Title
How to configure pie chart size in VChart?
Problem Description
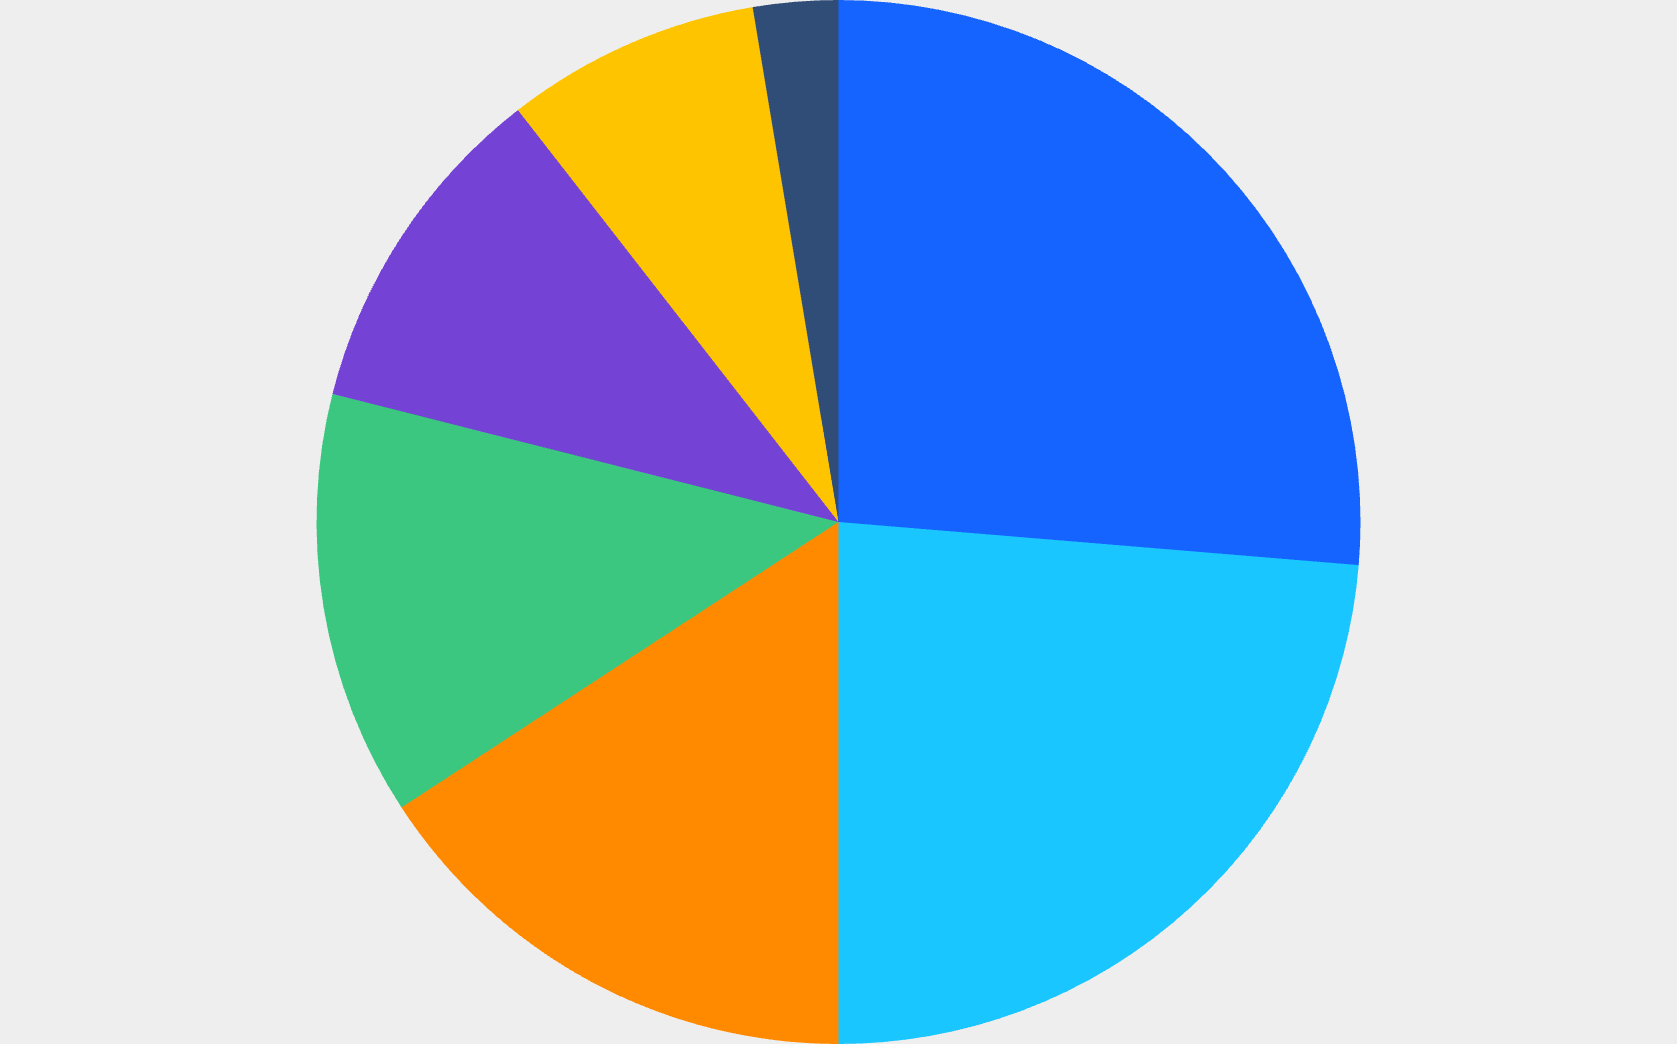
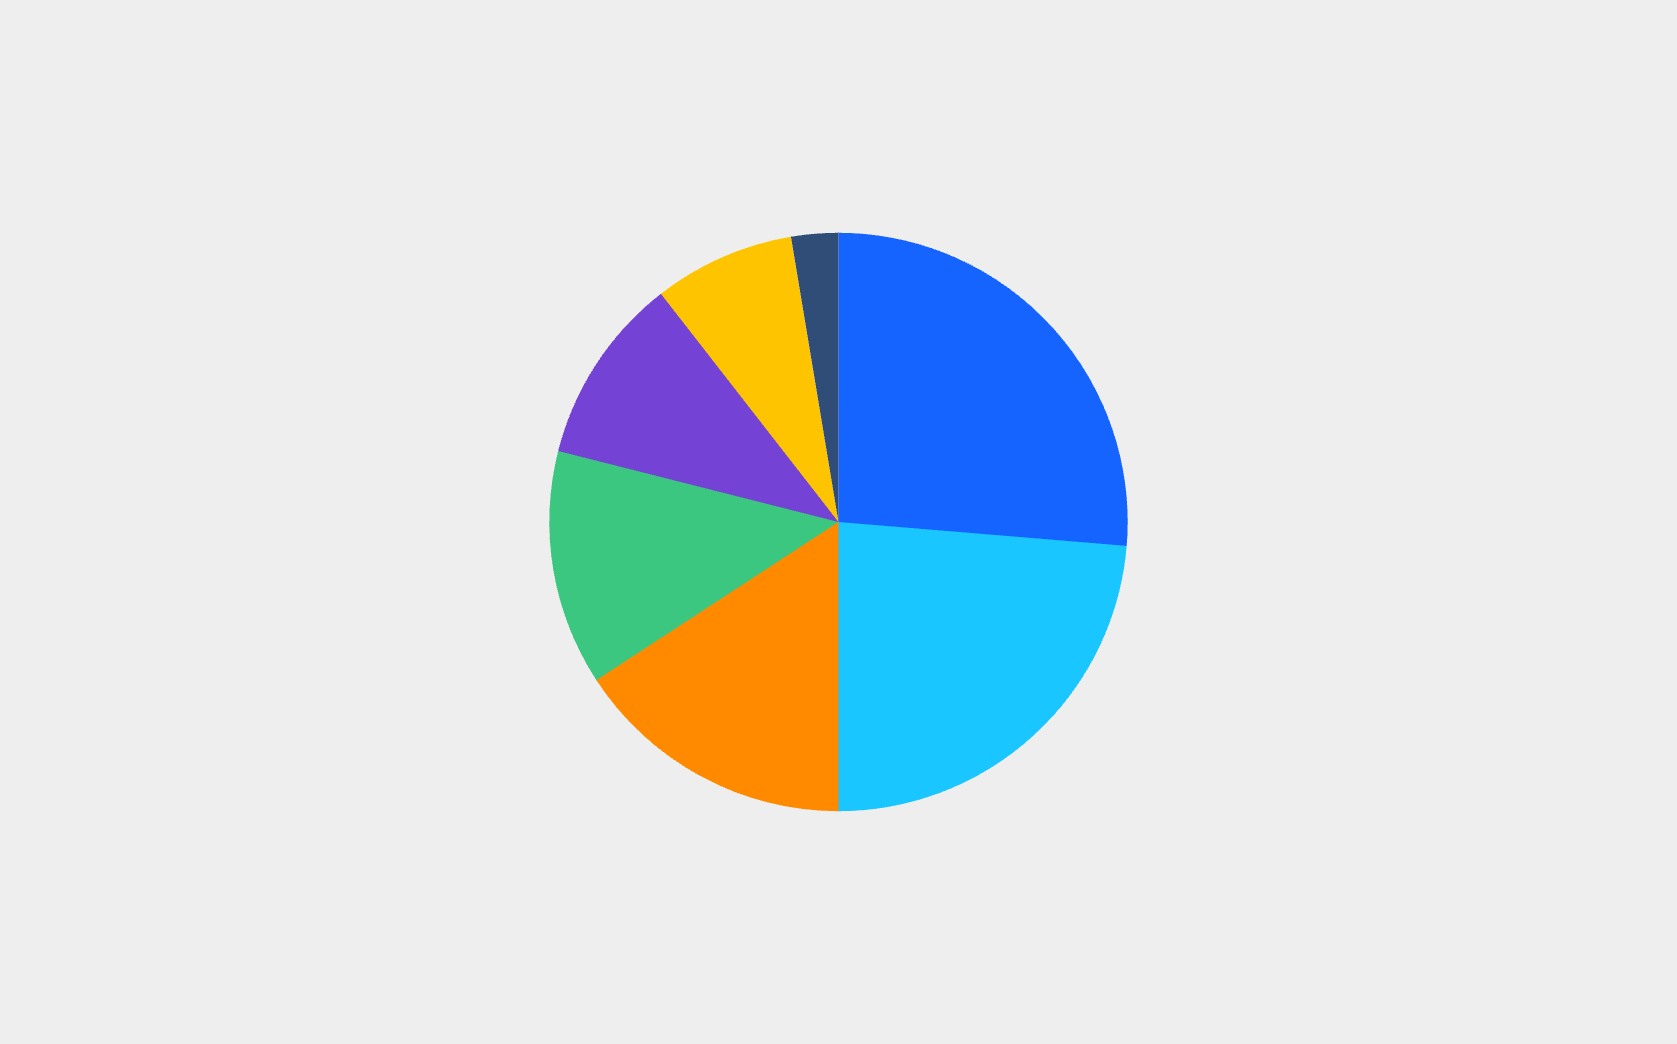
The page is narrow, how to adjust the configuration of VChart to make the pie chart occupy as much screen space as possible
Solution
- Cancel the default chart padding.
VChart sets a certain margin for all charts by default. You can configurepadding: 0to cancel the default margin. - Adjust the outerRadius the pie chart.
By default, the pie chart does not fill the entire canvas, you can configureouterRadius: 1to set the outer radius ratio to the highest.
Code Example
const data = [
  { value: 10, category: 'One' },
  { value: 9, category: 'Two' },
  { value: 6, category: 'Three' },
  { value: 5, category: 'Four' },
  { value: 4, category: 'Five' },
  { value: 3, category: 'Six' },
  { value: 1, category: 'Seven' }
];

const spec = {
  type: 'pie',
  data: [
    {
      id: 'pie',
      values: data
    }
  ],
  outerRadius:1,
  padding:0,
  background:'#eeeeee',
  categoryField: 'category',
  valueField: 'value',

};

const vchart = new VChart(spec, { dom: CONTAINER_ID });

vchart.renderSync();

// Just for the convenience of console debugging, DO NOT COPY!
window['vchart'] = vchart;</br>
Results


